File:Zero-K Overdrive Chart.png
Revision as of 04:03, 31 January 2018 by Oflameo (talk | contribs) (Oflameo uploaded a new version of File:Zero-K Overdrive Chart.png)
Zero-K_Overdrive_Chart.png (516 × 440 pixels, file size: 6 KB, MIME type: image/png)
Summary
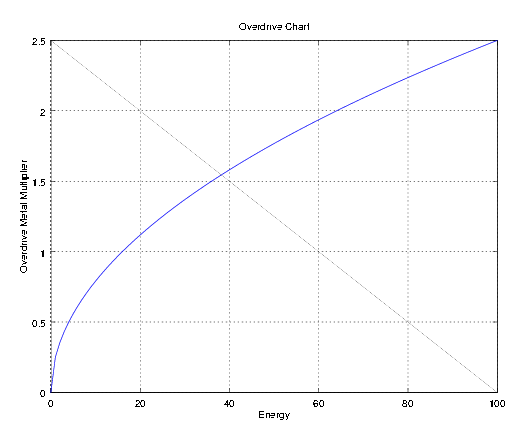
GNU Octave Script used to generate it below. The Output pdf was converted to png with ImageMagick.
---
x = 100; y = [0:100]; z = sqrt(z)/4 .*x; plot(y, z); title ("Overdrive Chart"); xlabel ("Overdrive Metal"); ylabel ("Energy"); grid on;
Licensing
| This work is licensed under the Creative Commons Attribution 4.0 License. |
File history
Click on a date/time to view the file as it appeared at that time.
| Date/Time | Thumbnail | Dimensions | User | Comment | |
|---|---|---|---|---|---|
| current | 05:27, 31 January 2018 |  | 516 × 440 (6 KB) | Oflameo (talk | contribs) | Finally got the axes straight. |
| 04:03, 31 January 2018 |  | 514 × 434 (6 KB) | Oflameo (talk | contribs) | Swapped swapped axes via report from @Sprung. | |
| 06:27, 23 January 2018 |  | 511 × 432 (6 KB) | Oflameo (talk | contribs) | Painted Alpha Channel White to make it easier to see on site. | |
| 06:20, 23 January 2018 |  | 511 × 432 (6 KB) | Oflameo (talk | contribs) | Cropped away some white space. | |
| 06:14, 23 January 2018 |  | 612 × 792 (8 KB) | Oflameo (talk | contribs) | ||
| 06:13, 23 January 2018 |  | 612 × 792 (8 KB) | Oflameo (talk | contribs) | GNU Octave Script used to generate it below. The Output pdf was converted to png with ImageMagick. --- x = 100; z = [0:100]; y = sqrt(z)/4 .*x; plot(y, z); title ("Overdrive Chart"); xlabel ("Energy"); ylabel ("Overdrive Metal"); grid on; |
You cannot overwrite this file.
File usage
The following page uses this file:
